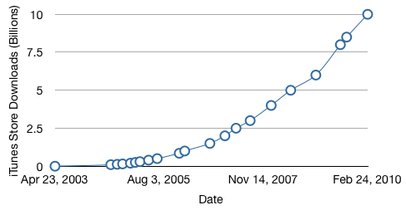
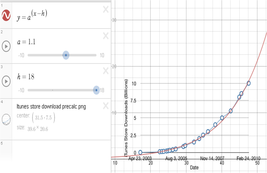
This graph appears to be a Exponential function. The domain is ...... and the range is.......... The future shape of my mathematical model will depend on how well the iTunes downloads keep selling. It depends on the sales and how much people buy. With how well iTunes has been doing recently my prediction would be that the graph will keep increasing over time, but eventually will decrease once iTunes stores become "unpopular". The domain and ranges will go up and down with the iTunes sales. There is a problem with trying to extend a set of data points to continuous functions because they can always change and become unpredictable over time.
 RSS Feed
