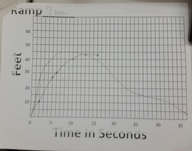
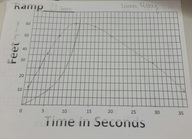
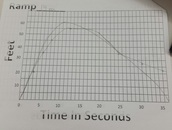
For all three of my graphs my predictions did not come very close. They were not close because I either did not know what was going on (the first one) or I my timing was off. The zeros of my graph represent where my prediction and the actual graph start at. The three graphs all start the same (positive) but they all have different maximums and minimums. The first graph (21 inches) has a maximum of 60 feet in 11 seconds, the second graph (14 inches) has a maximum of 55 feet and 12 seconds, and the third graph (7 inches) has a maximum of 43 feet in 13 seconds. They are all different because the skate board was placed at different starting points. For the first graph it was 21 inches, then 14 , and the last graph was 7 inches. The slopes of the graphs are also all different, although some are similar (but very slightly). The graphs are rising the fastest when it is first starting because it was when the skate board had just slid down the ramp. The graph is falling the fastest once the momentum has stopped. All of the graphs could also be affected by the driveway depending on if it was slanted or cracked.
 |  |
 RSS Feed
